Unreal Insights Link to heading
Unreal Insights is a telemetry analysis and capture tool that records events from your project at high data rates. It helps identify areas that may need optimization.
Users can record trace data to visualize network behavior with the following features:
- Packet Overview Panel: Displays packet timelines and sizes for transmitted or received data during gameplay.
- Packet Content Panel: Reveals packet details, including replicated objects, properties, and remote function calls.
- Connection Selections Panel: Controls information display based on game instance, connection, and connection mode.
- Net Stats Panel: Shows trace events for selected packets, providing statistics on total, maximum, and average (exclusive or inclusive) packet sizes.
- Net Stats Counters Panel: Displays recorded stats counters for the replication system.
Verifying Unreal Insights is Running Link to heading
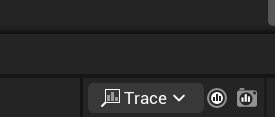
To verify that Unreal Insights is running, look at the bottom-right corner of your screen for the following option:
Then, select the option labeled Unreal Insights.
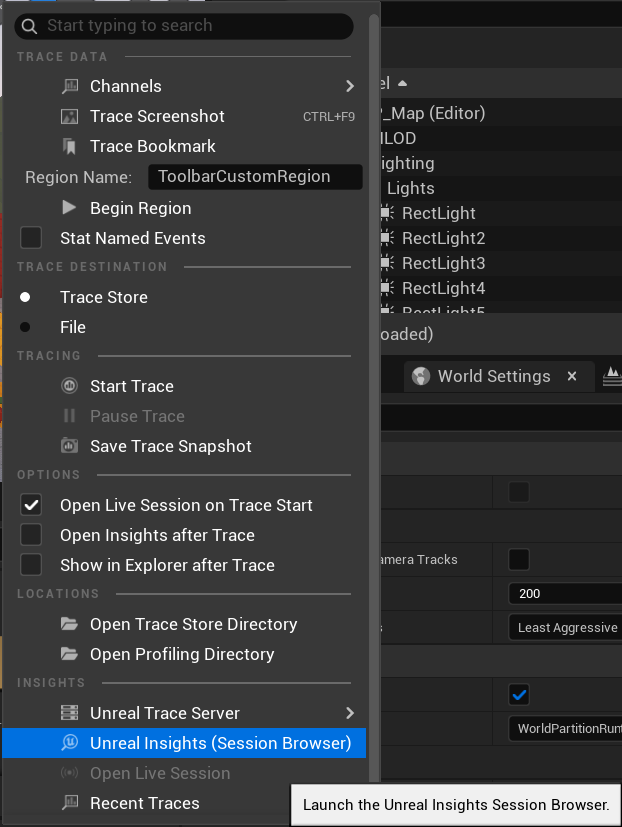
A separate program should open, and you should see a screen similar to the one shown below:
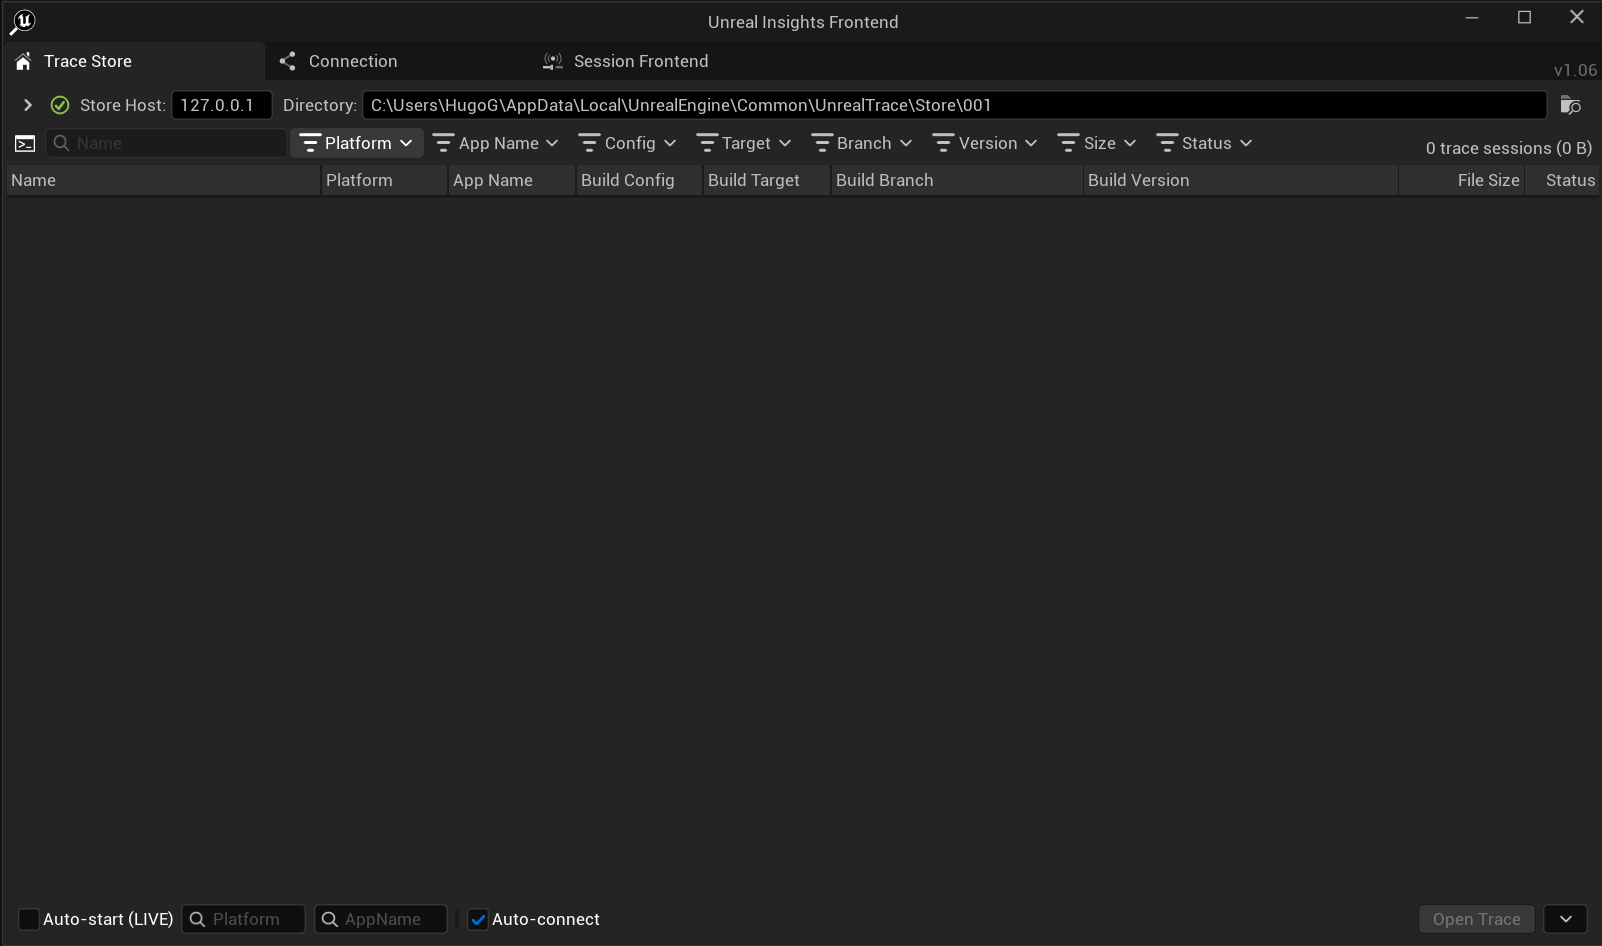
This window displays all the trace sessions you have recorded.
Starting a Trace Session Link to heading
To start a trace session, click the Start Tracing button, which is located next to the Trace tab.
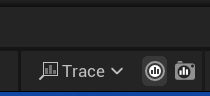
This button allows you to start and stop a trace session.
Once you end a trace session, it will appear in the Unreal Insights tab we previously viewed.

Double-clicking on it will open your trace session, allowing you to analyze your game’s events frame by frame from the moment you started tracing until you stopped it.
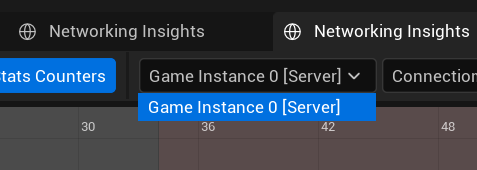
Why Does Unreal Generate Multiple Files? When running a trace session, Unreal Engine may generate multiple files. You will notice that one indicates that it belongs to the server and another to the client once you open the file, in the section shown in the following image
Configuring the Game for Networking Insights Link to heading
Before using Networking Insights, some configurations are required.
Navigate to: Editor Preferences > Level Editor – Play > Additional Launch Parameters
Enter the following command: -NetTrace=3 -tracehost=localhost -trace=net,cpu

- -NetTrace=3 → Specifies the amount of information to capture.
- -tracehost=localhost → Defines the destination for trace data.
- “localhost” means Unreal will send trace data to Unreal Insights running on the same machine.
- -trace=net,cpu
- net → Captures network-related events such as packet transmission, replication, and bandwidth usage.
- cpu → Captures CPU performance data, including function execution times and thread activity.
Setting Up a Multiplayer Session Link to heading
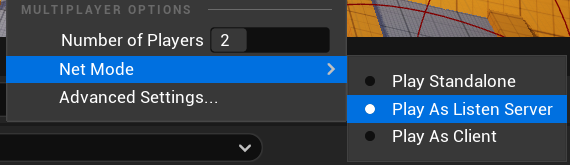
Configure the game to run with two players and set NetMode to “Play As Listen Server.”
Running a Trace Session in Standalone Mode Link to heading
The final step is launching your game in Standalone Mode:
- Start a Trace Session using the Start Tracing button.
- Run your game in Standalone Mode while the trace session is active.
- Perform all the actions you want to analyze in Network Insights.
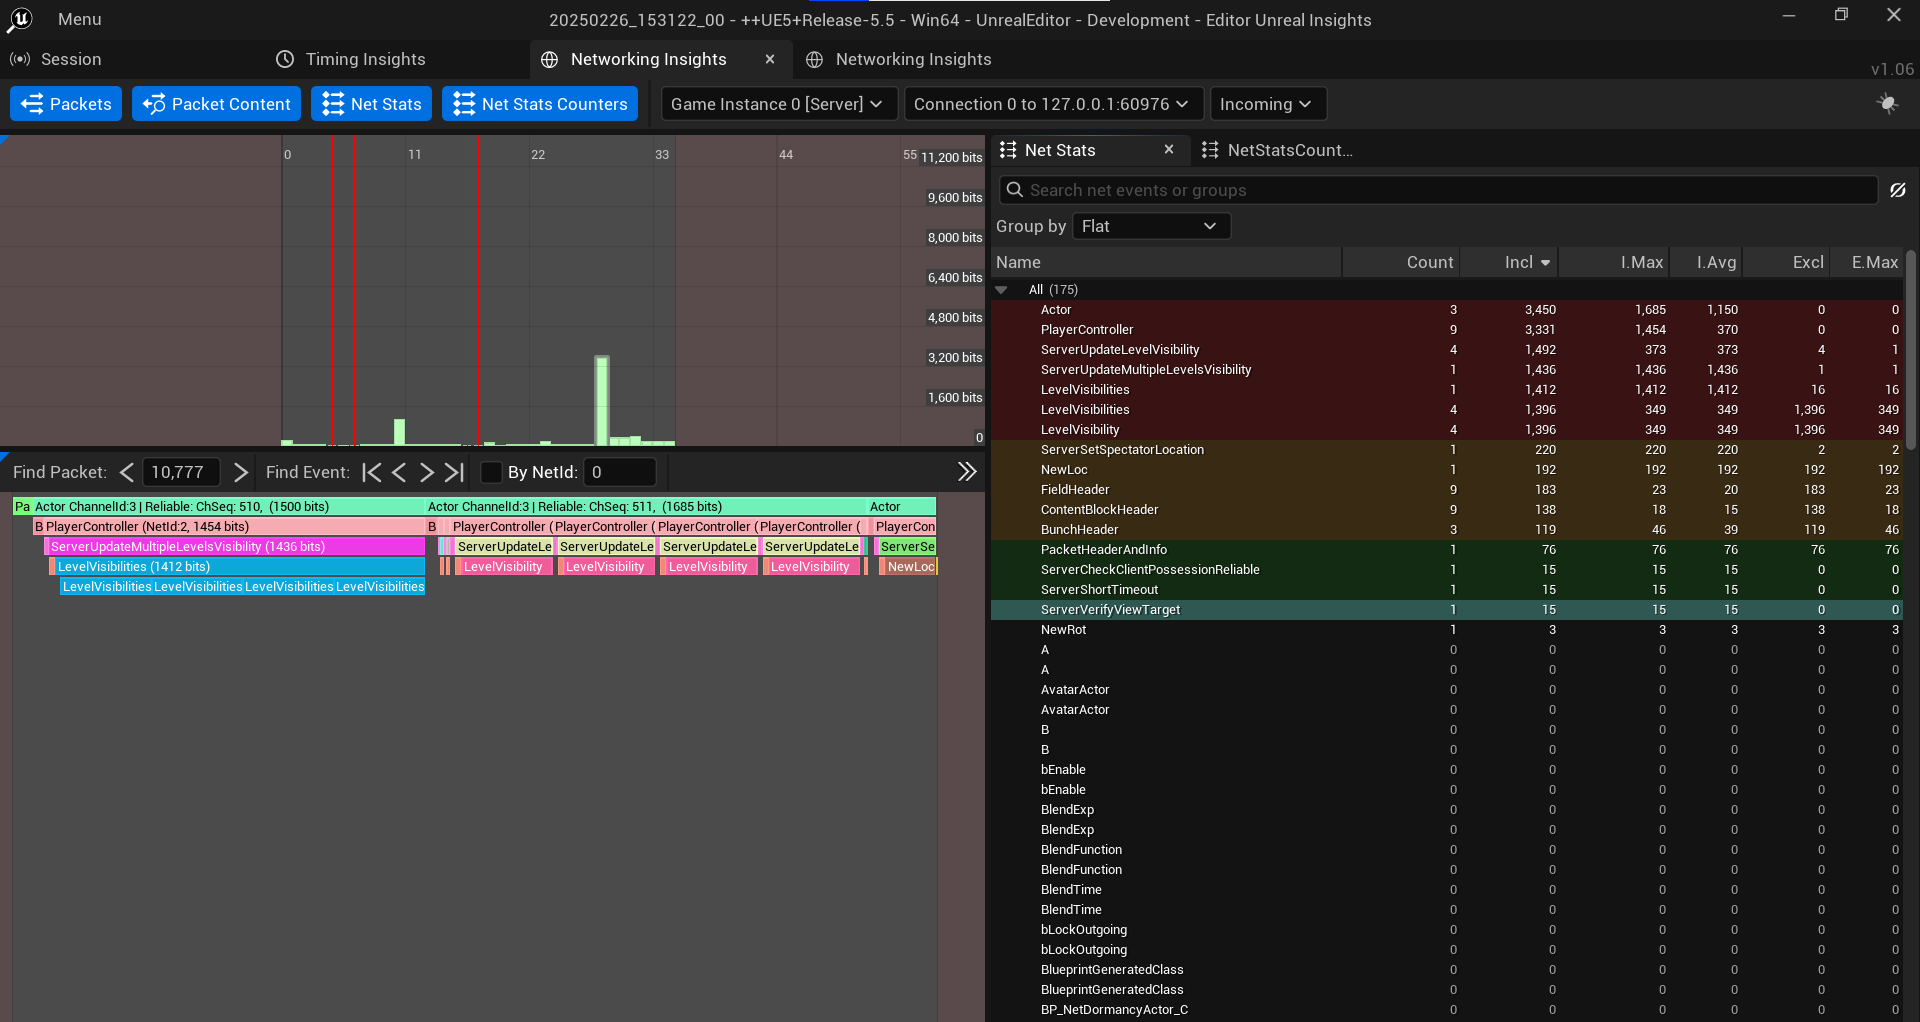
Once you open the trace session, you should see a window containing a Networking Insights tab.
Running a Trace Link to heading
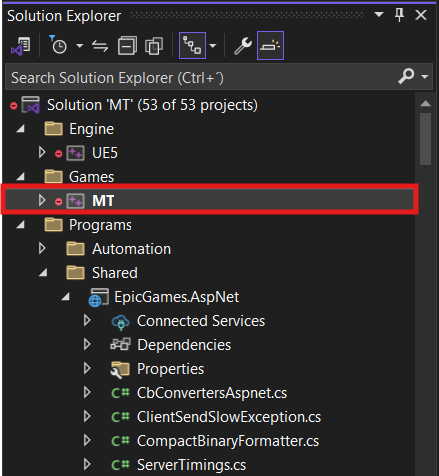
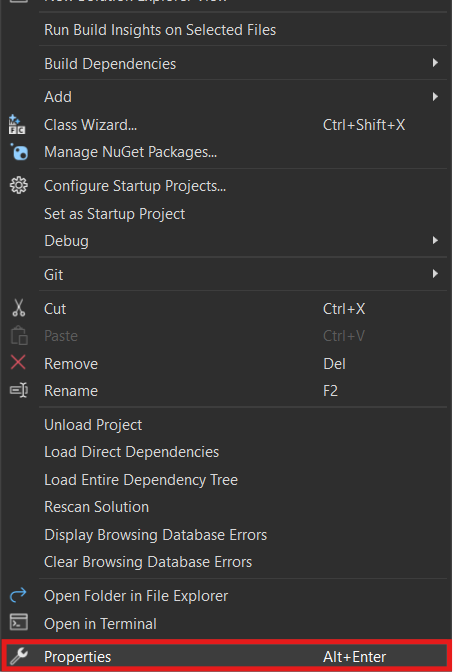
Unreal Insights can also collect Networking data from your multiplayer session in PIE mode, but this requires a few extra steps. In Visual Studio, find the file in the Solution Explorer that has the same name as your project. Right-click on it and look for the “Properties” option.
In this window, navigate to the Debugging section, and then in Command Arguments, add the following commands: -NetTrace=3 -tracehost=localhost -trace=net,cpu
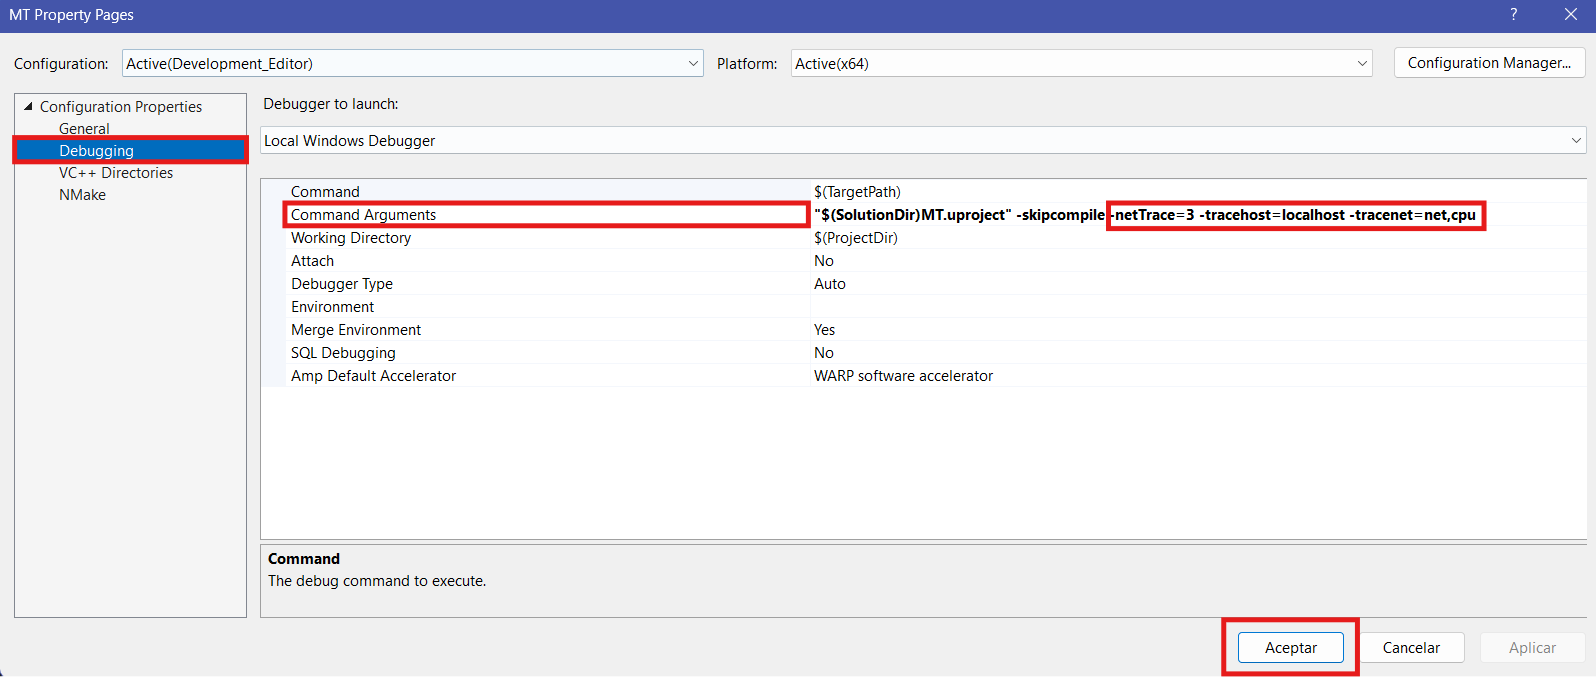
If there is already data in Command Arguments, it’s okay, you can add this right after the existing values. Disadvantages: it will auto-start tracing so it’s better to disable.
Packet Overview Panel Link to heading
The Packet Overview panel presents a bar graph representing the size (in bits) of each transmitted or received packet. This helps identify large packets that may require further analysis.
Packet Information: Hovering over a packet displays its details, including:
- Packet Index
- Sequence Number
- Content Size (in bits)
- Total Size (in bytes, including unused bits)
- Timestamp (when the packet was sent or received)
- Packet Status (delivered or undelivered)
- Connection State (when the packet was received)
- Engine Frame Number (when the packet was sent or received)
Highlighting Packets:
- Dropped packets appear in red.
- Use Shift + Click to select multiple packets.
- Highlighting an event in the Packet View shows its bit usage within the packet.
You can choose to highlight either:
- The aggregated bit count for all instances of the event.
- The maximum bit count used by a single event.
Packet Content Panel Link to heading
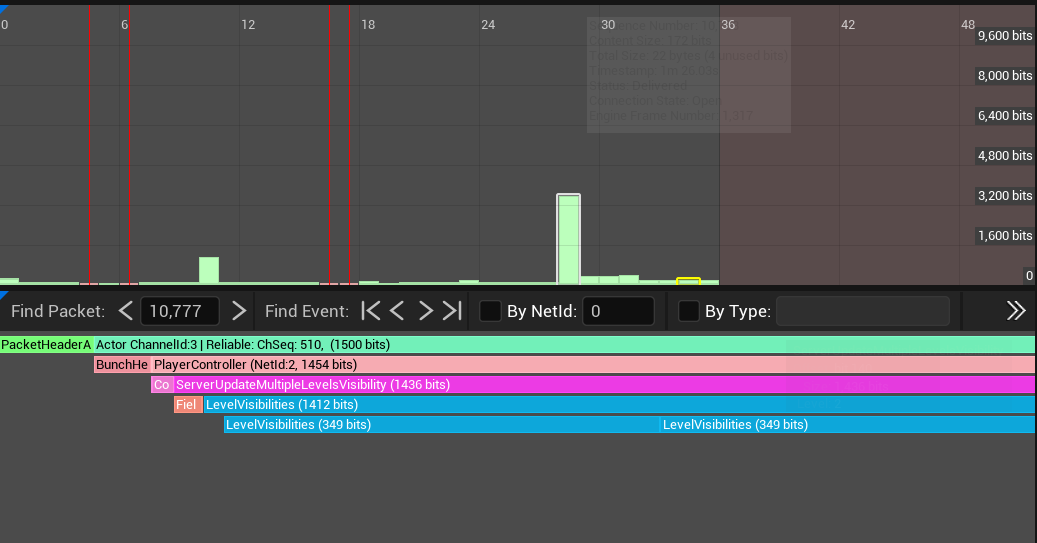
The Packet Content panel displays the selected packet’s data as a hierarchical event graph, starting from bit zero on the left.
Packets contain multiple layers of information:
- Level 0 (Top Level) → Shows the bunches within a packet.
- Each bunch is labeled with the channel it belongs to.
- If a debug name is assigned, it replaces the channel name for better clarity.
- Example: PacketHeader, Actor ChannelId: 28, Actor ChannelId: 4.
- Level 1 (Detailed View) → Shows replicated objects inside the bunch.
- If an event has a NetId (NetGUID), it is displayed here.
- For traced events, NetId appears as NetId:NN until officially assigned.
Filtering Packets by NetId and Event Type Link to heading
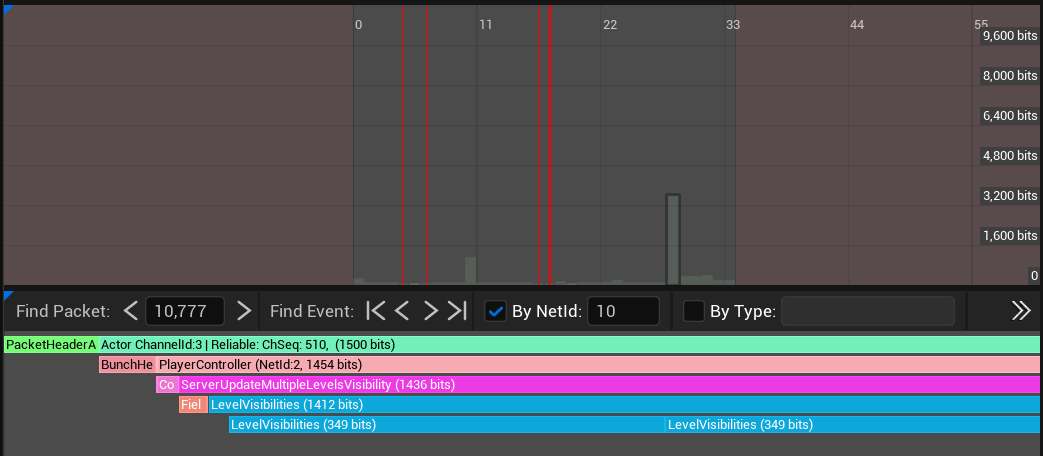
Packets can be filtered by NetId and event type.
To filter by NetId:
- Enable the checkbox for NetId filtering.
- Enter the NetId you want to analyze.
To filter by packet type:
- Enable the “By Type” checkbox.
- The box will populate with the selected packet content type.
Connection Link to heading
Dropdown List: A menu that allows users to select from a list of options or values.
Description: Provides additional information or details about a particular element or feature.
Game Instance: Represents a created instance of the game for each unique NetDriver recorded during the session.
Connection: A selection option that allows users to choose a specific connection, displaying all observed connections during the session of the selected Game Instance.
Connection Mode: A setting that controls whether the incoming or outgoing data is visualized.
Net Stats Link to heading
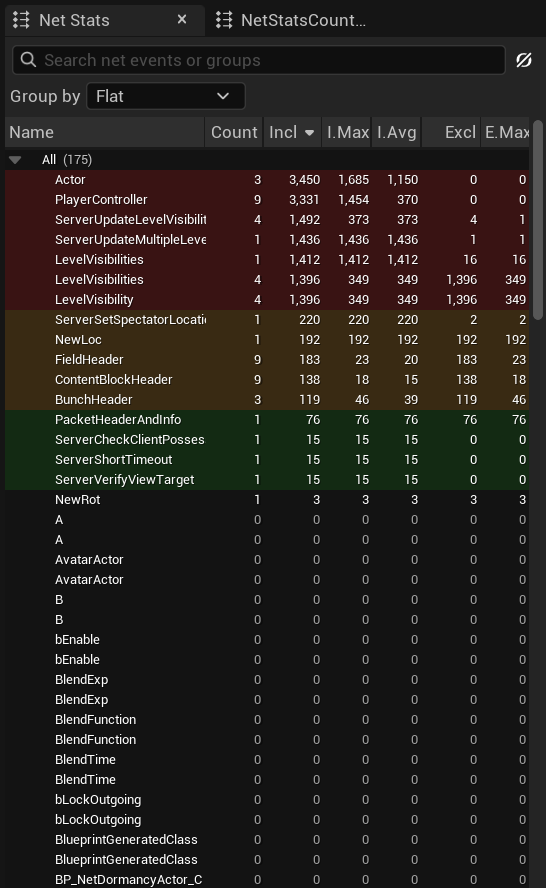
- Data can be grouped within a selected range.
- Users can sort columns in ascending or descending order.
- To filter events by name, use the “search net events or groups” field.
Net Stats Counters Link to heading
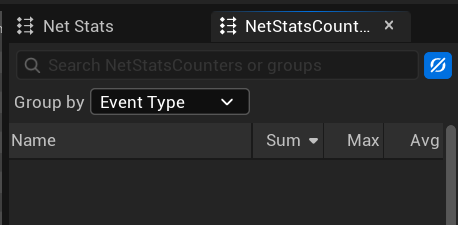
Types of Stats Counters:
- Frame Stats: Track statistics for the entire frame, primarily network-related data shared across connections.
- Packet Stats: Track statistics for individual packets, such as:
- Objects scheduled for serialization.
- Objects that actually fit into the packet.
To add information to this panel, use the following macros in your C++ code:
UE_NET_TRACE_FRAME_STATSCOUNTER(<GAME_INSTANCE_ID>, <STAT_NAME>, <STAT_VALUE>, <NET_TRACE_VERBOSITY>)
UE_NET_TRACE_PACKET_STATSCOUNTER(<GAME_INSTANCE_ID>, <CONNECTION_ID>, <STAT_NAME>, <STAT_VALUE>, <NET_TRACE_VERBOSITY>)
Replicated Objects Link to heading
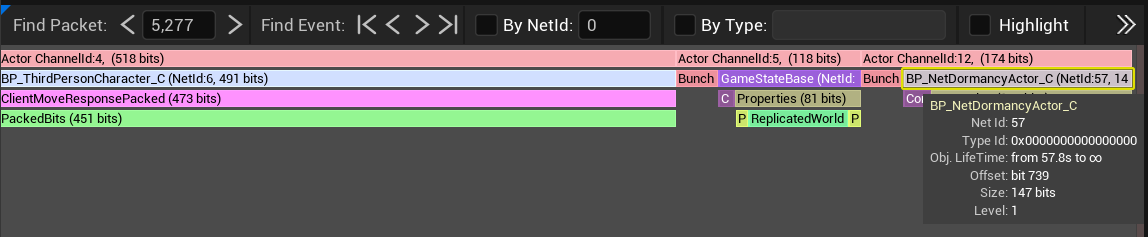
Before the bunch containing the new actor, there is a NetGUID bunch with all exported references from the new actor, including their NetGUIDs.
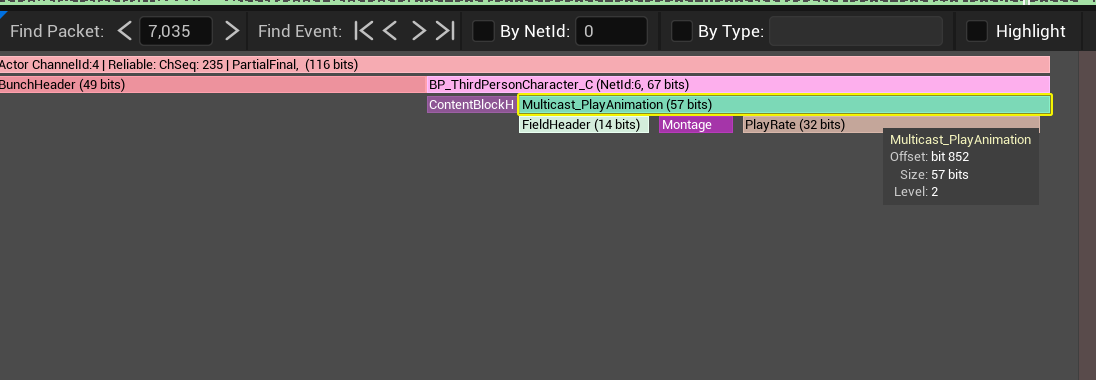
Remote Procedure Calls (RPCs) Link to heading
References Link to heading
Unreal Insights in Unreal Engine | Unreal Engine 5.5 Documentation | Epic Developer Community. (2024). Epic Games Developer. https://dev.epicgames.com/documentation/en-us/unreal-engine/unreal-insights-in-unreal-engine