Network Profiler Link to heading
It is a standalone tool designed to show network traffic and performance data collected by Unreal Engine while a game is running.
Record a profiling session Link to heading
To use the network profiler, you must first record data, which requires an engine version with stat tracking enabled. This usually means using a debug or editor build, with the engine compiled with the STATS macro set to a nonzero value.
Console commands Link to heading
- netprofile: toggles recording on and off
- netprofile enable: start recording if not already recording
- netprofile disable: stop recording if currently recording
Considers that it can record profiling data from both clients and servers, but keep in mind that only servers replicate actors and their properties. When viewing a profile recorded on a client, you’ll only see detailed data for RPCs sent from that client.
Viewing a profile session Link to heading
The profiling data file is saved as < PROJECT_DIRECTORY >/Saved/Profiling/< PROJECT_NAME >-< TIMESTAMP >.nprof. If you notice a file called NetworkProfiling.tmp in the same directory, it is a temporary file used by the engine during data collection. Once the profiling session ends, this file is renamed following the pattern mentioned above and can then be opened in the standalone network profiler tool.
The network profiler is a standalone application located at < UNREAL_ENGINE_ROOT >/Engine/Binaries/DotNET/NetworkProfiler.exe
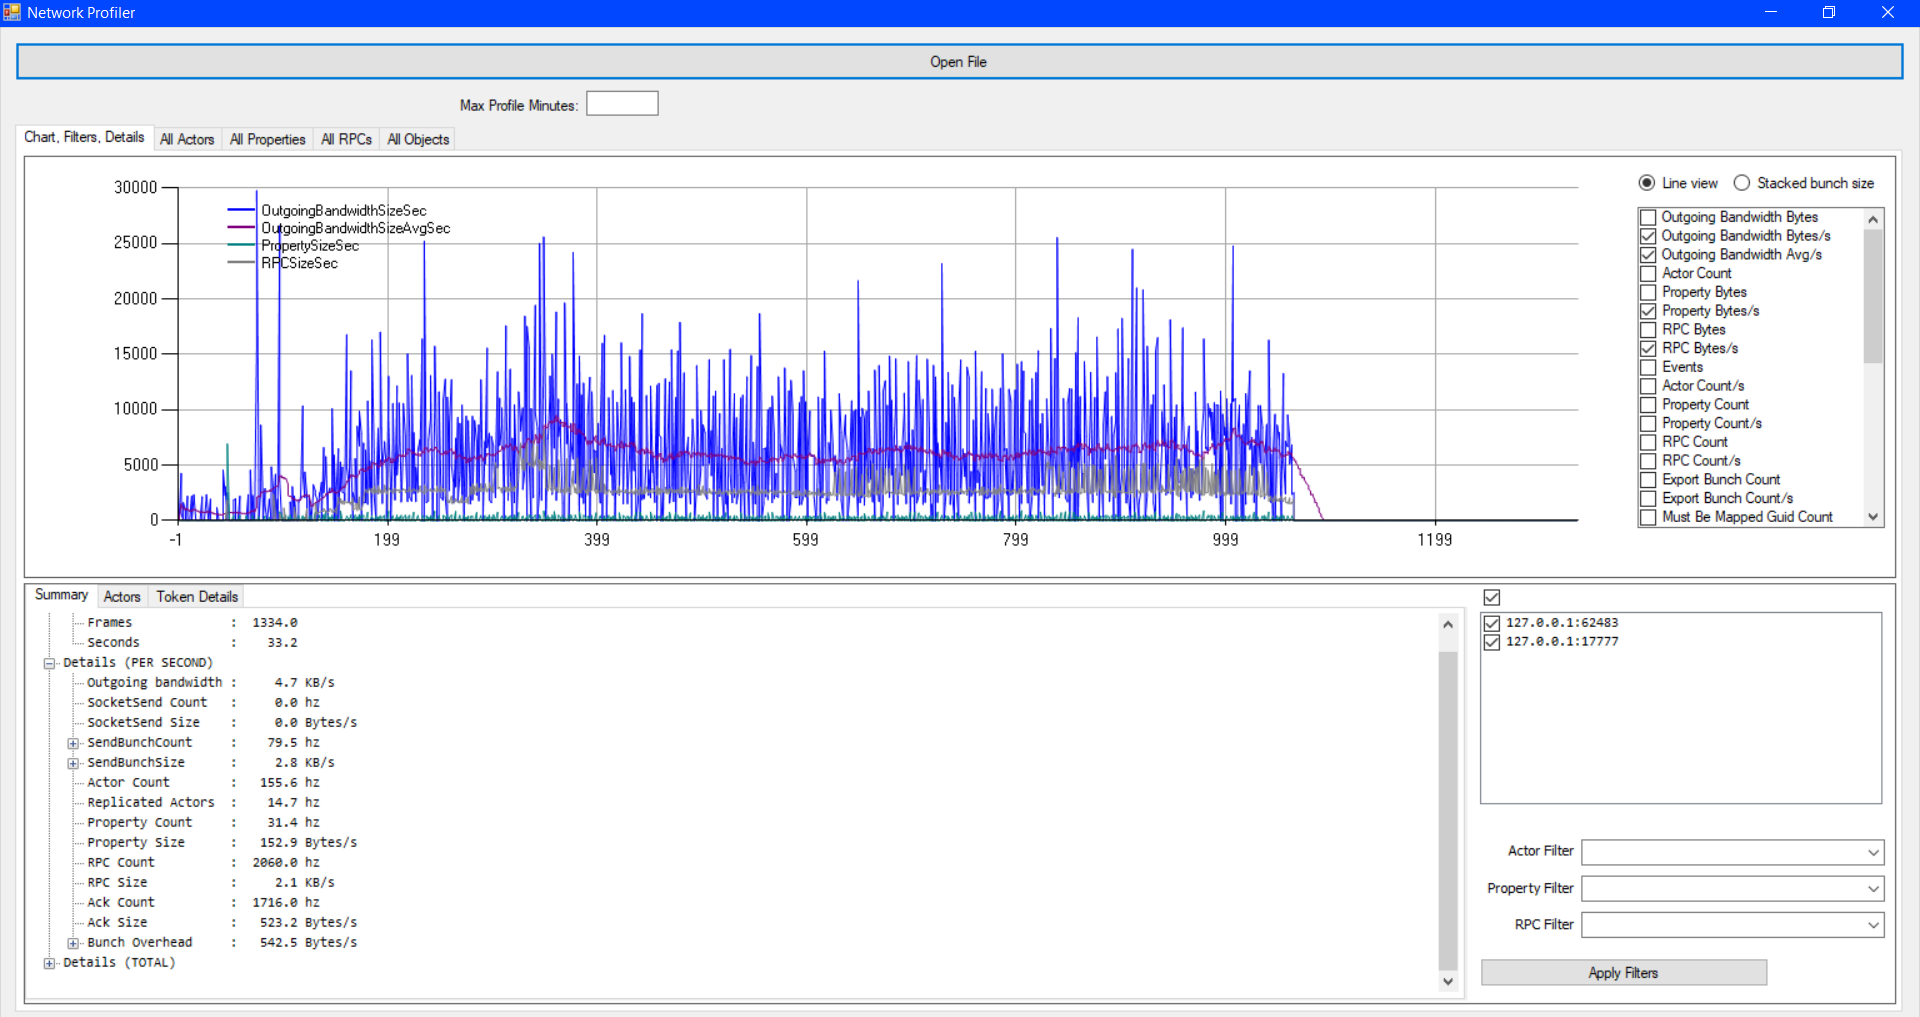
The Network Profiler tool in Unreal Engine provides various views to analyze network traffic and performance during gameplay. The View Tabs allow you to select the type of data you want to observe, such as Chart, Filters, and Details.
Chart: Displays a graph of network stats over time. You can click or drag across the graph to zoom into specific time spans.
Stats List: Lists all the tracked stats, with checkboxes to show or hide each stat in the graph, and options to display the data in various formats (raw count, bytes, etc.).
Details: Shows more in-depth information, including summaries for the selected time span, actor replication, and data sent during each frame.
There are specific views to explore various network elements:
All Actors: Shows replication data for all actors in the session, detailing average and total size, time spent replicating, and the number of replications.
All Properties: Displays data for all properties, similar to the All Actors view, but focused on properties.
All RPCs: Shows information about all RPCs (Remote Procedure Calls) that were profiled, similar to the All Actors and Properties views.
All Objects: Displays information about objects, with data on comparisons, replications, and time spent. Additional features include:
Token Details: Breaks down data sent in the selected frame, showing actors, properties, and RPCs, with details on the bytes transmitted.
Filters: You can filter actors, properties, and RPCs by text to display only relevant data in the graph and other views. Overall, this tool helps to analyze network performance, replication details, and optimize bandwidth usage.
References Link to heading
Using the Network Profiler in Unreal Engine | Unreal Engine 5.5 Documentation | Epic Developer Community. (2025). Epic Games Developer. https://dev.epicgames.com/documentation/en-us/unreal-engine/using-the-network-profiler-in-unreal-engine
Testing, Profiling, and Debugging Unreal Engine’s Networking | Knowledge base. (2025). Epic Games Developer. https://dev.epicgames.com/community/learning/knowledge-base/kjm3/testing-profiling-and-debugging-unreal-engine-s-networking